Tracer 3D Display
The electronic signals that are recorded by the detectors during a collision can be transformed into event displays.
To visualize these, we use an application Tracer 3D Display (Tracer Events Display).
Before you begin working with Tracer 3D Display, you should learn about its features and functions which will be used in our analysis.
To get started, simply access
Tracer 3D Display
directly from your browser—no installation is required.
As a participant in the International Masterclasses:
- Enter the City where your Masterclass session takes place.
- Fill in your group number.
Once you've filled in the required information, start your masterclass session by clicking on "
Event Display."
-
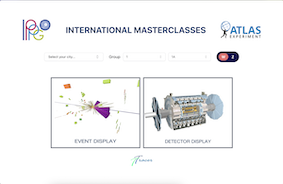 This is the student registration page for starting the masterclass session. Students should enter the values provided by their mentors.
There are two applications available for students: Tracer Events Display and Detector Display.
-
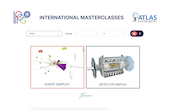 The Events Display is specifically designed for the actual masterclass session, focusing on event analysis. Therefore, to participate in the masterclass, students should select the Events Display option.
-
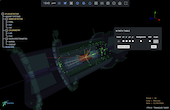 This is how Tracer EVD-MC looks in action. At the start, you’ll see a particle collision animation, followed by the drawing of event objects. On the left side, there’s a geometry menu where you can easily load or hide Atlas detector geometries by clicking on the titles. The top menu provides all the essential tools for event analysis. On the right, there’s a draggable table for entering analysis results. The scene is interactive, with all necessary controls, and event objects are clickable to display their information.
-
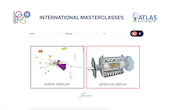 Before or after the masterclass session, students can explore the Detector Viewer to see more detailed geometry of the ATLAS detector. They can interact with these models and view descriptions of different parts.
-
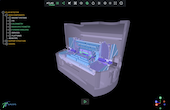 This is the Detector Display application, which we call the ATLAS Viewer. Unlike Tracer EVD-MC, this application is not used for event analysis but rather for exploring a more detailed view of the ATLAS detector. The geometry tree on the left side is quite complex, and you can click on geometries within the scene to check and even modify their parameters. If you’re interested in learning more about the structure of the ATLAS detector, this app is designed for you.
The app should look much like the first picture in the picture gallery.
Use the following gallery to get some insight into the functions of TRACER!
Trying out the features you will read about is a good way to get accustomed to the app.
Have fun!
-
 In this image, you can see that all elements of the geometry tree on the left are blue, indicating that the entire ATLAS detector is loaded.
-
 In this image, you can see that some elements of the geometry tree on the left are loaded, while others are hidden. The blue color indicates that a geometry is fully loaded along with all its children. The yellow color shows that the geometry is partially loaded, meaning only some of its children are visible in the scene. The grey color indicates that the geometry and all its children are fully hidden from the scene.
-
 The top menu contains most of the tools needed to analyze events or adjust the scene and geometry parameters. There’s an icon for the event menu, which, when clicked, opens a draggable window. From this event menu, you can apply filters to event objects, hide or show event objects in the scene, and view detailed information about the event.
-
 From the tools menu, you can apply various cut options to the geometries, including predefined cuts and a customizable cut slider.
-
 From the tools menu, you can apply various cut options to the geometries, including predefined cuts and a customizable cut slider.
-
 From the tools menu, you can apply various cut options to the geometries, including predefined cuts and a customizable cut slider.
-
 In the scene, you can see various event objects such as tracks (yellow lines), jets (cones in a deep purple color), MET (a red dashed line), and cells (if activated, these appear as color-coded blocks representing their energy values). Energy deposits in the LAR are displayed as green 3D rectangles or bars, while MUON segments appear as blue lines, located farther from the center within the muon spectrometer geometry.
You can click on any event object to check its parameters, such as energy, transverse momentum (pt), object type, charge, and more.
-
 When an object is selected, its color changes. In this image, the red dashed line, representing MET, has been clicked, and its information is displayed. Since it’s selected, its color has changed to orange.
-
 In this image, one of the LAR energy deposit bars is selected, and its corresponding information is displayed.
-
 In this image, the cells of the Tile Calorimeter are activated, and one of the cells is selected. Below, you can see its corresponding information.
-
 In the “W Path Table” window, you can see a list of events. Only the current event, (which the student is analyzing) is activated for selecting a result. Once you’ve determined the type of event, you can choose the corresponding radio button. The “Angle” field is only enabled when you identify the event as a “WW” event.
-
 After selecting the event type, press the “Next” button located at the bottom right to proceed to the next event. Do not click “Submit Results” unless you are ready to finish the entire masterclass session. When you click “Next,” the next event will automatically load, allowing you to start the event analysis immediately.
-
 The “Angle” field is activated when you select a WW event, where you need to enter the angle between the two detected leptons (electron, positron, muon, or antimuon). You can check the angle between tracks by selecting multiple tracks simultaneously while holding down the Ctrl key and clicking on them.
-
 If you want to edit a previous event result or simply review an event, you can click the edit icon next to the event you wish to load.
-
 After analyzing all the events, to complete the masterclass session, click the “Submit Result” button. You will be directed to the results page, where you can review your answers and see the results of other teams.
Now, find out how you can identify particles with the help of TRACER.


